26
srpna
2018
Integrating Nette Tester and Teamcity CI/CD server
I’ve been using Nette Tester for a few years now, as I find it much more usable and straightforward than PHPUnit (disclaimer: I did use PHPUnit only for one very small project, a long time ago. It may be a good tool.). I also have a rudimentary deploy system in place using Git hooks, but it’s far from perfect – a lot of work must be done manually: composer install, deleting caches (if you use Nette Framework you know what I mean) and, most importantly, running those tests before actually pushing stuff.
Now sure, I could just improve the hooks, but then every commit/push (depending on which hook I’d use) would take a lot longer to complete, slowing me down. And making the hooks really bulletproof in all the edge cases would be just a lot of work for very little improvement.
Luckily, just as I was contemplating my situation, I was also experimenting quite a bit with JetBrains’ team offerings, especially YouTrack, as I’m always for the lookout for a usable time-tracking task list, and if it integrates with my IDE, all the better. And it was just a click away to find TeamCity, which promises to not only build, test and deploy my software, but also keep track of the test successes and failures, durations of those tests, monitor code coverage, provide timeline statistics for all those metrics and generally provide a lot of insight into the quality of my work.
The only trouble was, TeamCity has most integrations for Java a .NET projects, PHP is not supported out-of-the-box. Still, it can work with command-line tools, so anything with sensible exit codes can be made a build step, with anything except 0 failing the step and halting the deployment. So, with just that, you get a centralized deployment and error-reporting solution.
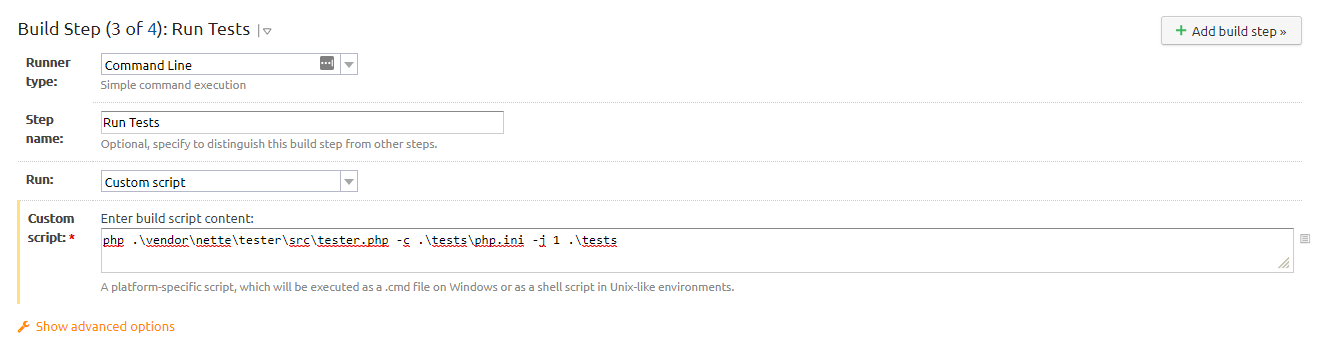
That’s all that it takes for a basic integration of Nette Tester into TeamCity. Previous two steps are calling composer install and if exist temp\cache rmdir /Q /S temp\cache. For testing purposes, it runs on my Windows box, moving to a Linux utility box is scheduled for when I have time.
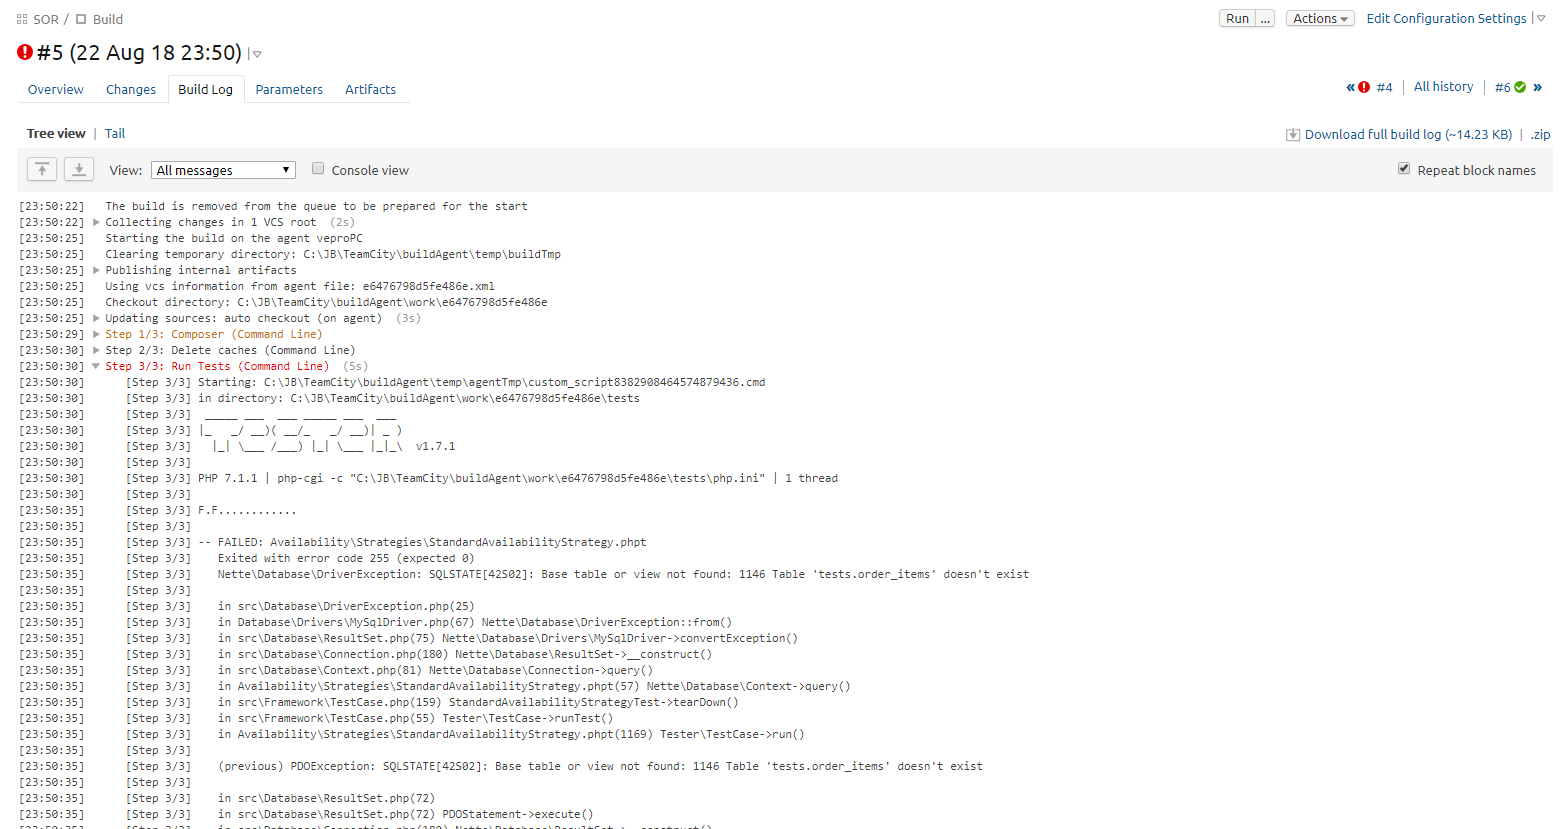
You already have access to the build logs, where all your errors can be read in plain text. Still however, you’re missing on the conveniences that come when TC can parse your output like real-time feedback (you can see completing/failing tests as the appear, not after the whole tester returns), so let’s improve that.
Reporting on individual tests
Turns out, TeamCity supports its own message formats, and if it detects supported message in the stdout, it starts displaying all the fanciness it can. So, let’s bake that into Nette Tester.
Luckily, NT supports custom output handlers, that’s anything that implements the Tester\Runner\OutputHandler interface. And you can set NT to use your handler with a setup script, as shown in documentation. And the good news don’t end here: someone else has actually already done most of the work implementing the TeamCity compatible output handler. Jiří Pudil has a PHPStorm plugin for Nette Tester, and it’s setup.php script is just what we need. There’s just one minor trouble that it’s for an older version of Tester, but it’s mostly a matter of renaming and calling new APIs.
So now, we have to place that setup.php file somewhere within our project, and modify the command line accordingly:
php .\vendor\nette\tester\src\tester.php -c .\tests\php.ini --setup .\tests\setup.php .\tests
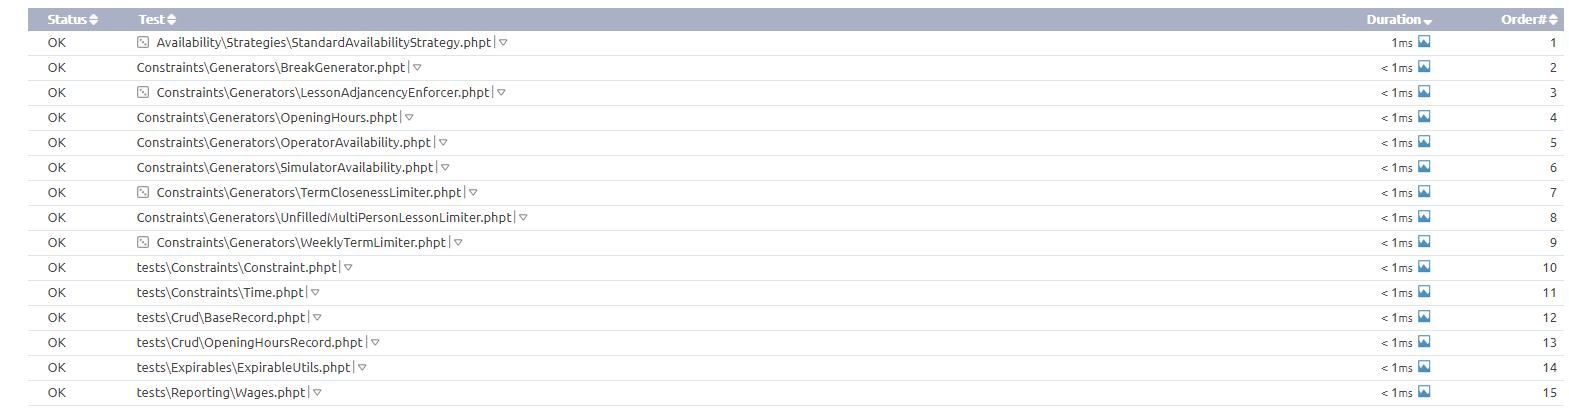
Woo! We’re getting all the individual tests here. From now on, we’ll have a tracking of when each of them failed, so we’ll know not only that something is broken, but also what.
Displaying test durations
Still, there’s room for improvement. Performance is a major factor nowadays, so having an idea of how long the test took would be a big help in case we’d introduce a major slow down in one of the commits and only find out later. For this reason, TeamCity offers a timeline of duration, so you can see whether the increasing of test duration was gradual, or (as is often the case) sudden, and therefore usually easy to pinpoint to a specific commit and a specific feature.
There’s a problem there tough: Nette Tester doesn’t call the OutputHandler when a test is starting, only when it’s finishing. Still, as with most things Nette, the code is elegant and easy to customize. I added the support for a new StartAwareOutputHandler in 14 lines of code, not including definitions and tests. Feel free to either cherry-pick that commit, or use the whole fork (however, I’d recommend rebasing to the current Nette Tester version after that, as I probably won’t be maintaining that fork much).
Now, we’ll just upgrade the setup.php with the newly introduced start method, move the testStarted message into it and implement a time-measuring associative array. Here’s my take at it.
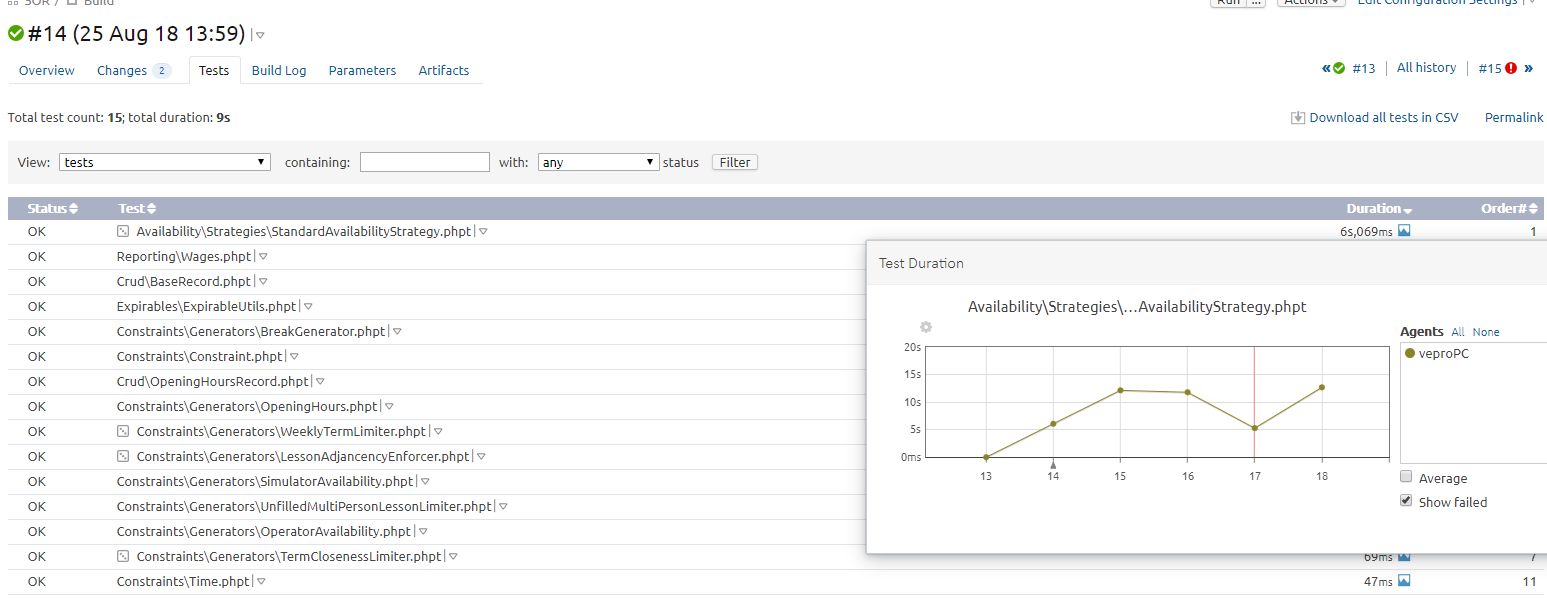
With that done, the same command line step will yield durations, and after a few builds, a nice test duration timeline.
Enabling test coverage statistics
That’s about all that can be done for tests, but there’s still the issue of code coverage. You probably want to track how your coverage is changing over time, so that you know that the sudden prevalence of bugs reported from production is caused by your decision to rush development and skip tests. We’ve all been there :-)
Again, integrating Code Coverage reports into TeamCity is not something that works out-of-the-box, but is doable. For statistical purposes, we’ll use the XML output. NT uses the Clover format, same as PHPUnit, but again, TeamCity prefers its own message format. And again, there is a simple, already existing solution on GitHub. We’ll need to include the file with composer install (as is described in the readme), and then we’ll need to modify our test runner to both output the coverage XML to a file, then add a new step to read that XML, stdout the TeamCity messages and finally either delete the XML or archive it as a build artifact. I’m going to delete it, as I’ll be archiving the human-readable HTML report instead.
The new Tester command is straightforward, we’ll just add the coverage option and the sources root for it (otherwise, coverage will be generated for all files, including /vendor)
php .\vendor\nette\tester\src\tester.php -c .\tests\php.ini --setup .\tests\setup.php --coverage .\tests\coverage.xml --coverage-src .\app .\tests
Now we need the coverage output. We can either add it as additional commands into the Tests step, or create a new step. I created a new one, and set it to run the following custom script:
.\vendor\bin\teamcity-clover.bat .\tests\coverage.xml
del .\tests\coverage.xml
Again, it’s a Windows command, on *NIX, you won’t need the .bat and you’ll use rm instead of del. And, of course, use forward slashes.
With this, you should see a coverage report in the Overview tab of your build, and in the Parameters tab, under Reported statistic values link, you can track the changes over time (especially of the Percentage of Line/Block/Method/Class coverage, but other parameters are useful as well. And you can create your own parameters here, too, just output them in the TeamCity’s buildStatisticValue message format and they’ll be tracked.)
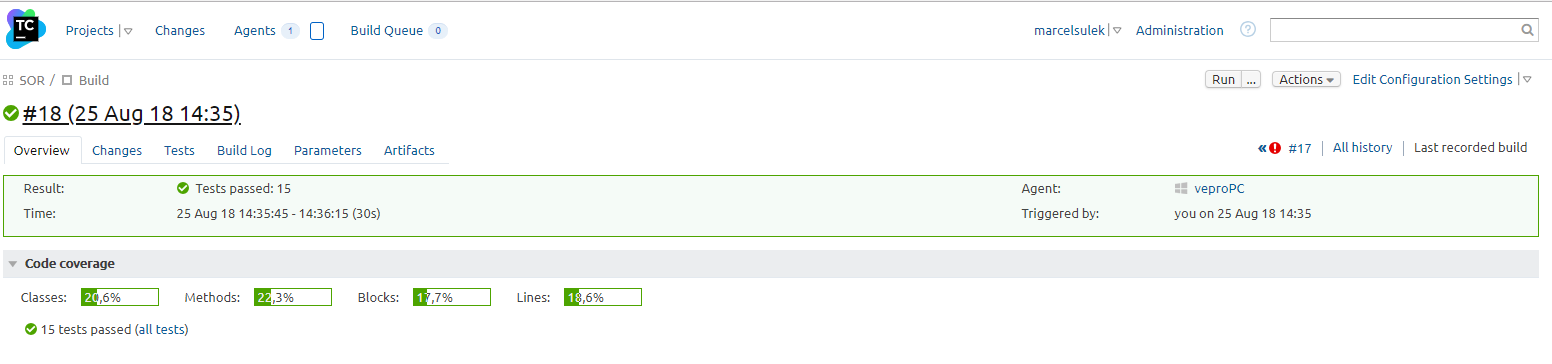 I definitely have room for improvement here…
Displaying human-readable coverage report
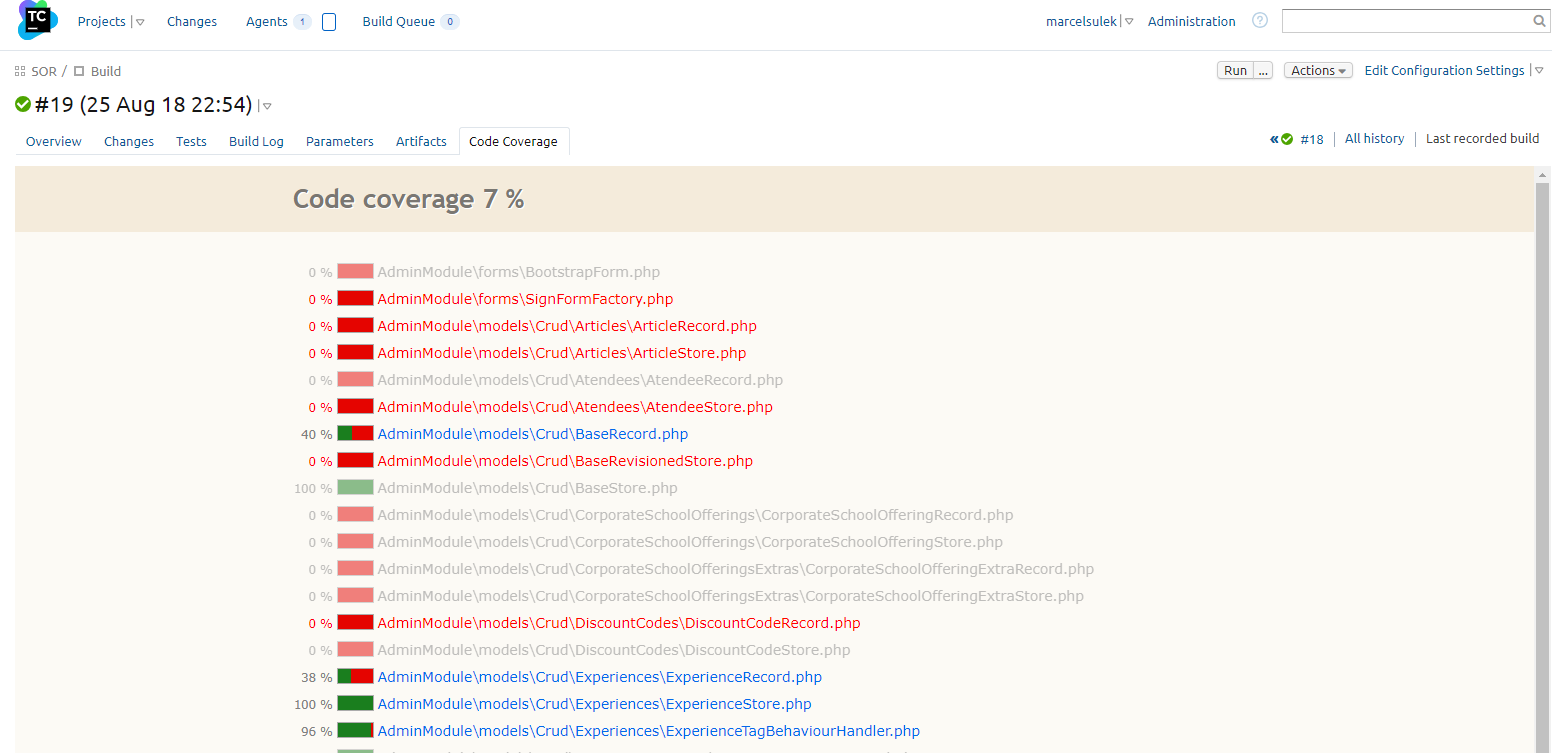
And we’re finally at the last step: archiving the coverage report as HTML, so that we can inspect it whenever we need. It’s simple: we’ll generate the HTML and tell TeamCity to create a build artifact out of it. And if we stick to conventional naming, it will generate a nice “Code Coverage” tab on our build page.
There is one problem however: to simplify user experience, Nette Tester has just one –coverage parameter, outputting HTML or XML by detecting the appropriate prefix. But you can’t output both files in one run, at least not without some (minor) modifications to CliTester.php. At this point, I’m running the tests twice, once for XML generation, then again for HTML generation. It takes double the time, but I don’t have to tweak the CliTester and break compatibility just yet.
Now, the way TeamCity displays the coverage is that it shows and iframe of the directory, starting with index.html. Therefore, in our new Command Line step, we’ll need to create a new directory, and after that, call the Tester.
if not exist .\tests\coverage mkdir .\tests\coverage
php .\vendor\nette\tester\src\tester.php -c .\tests\php.ini --setup .\tests\setup.php --coverage .\tests\coverage\index.html --coverage-src .\app   .\tests
Next, we’ll switch to the General Settings tab and create a new Artifact path by appending a line to whatever paths we already have
tests/coverage => coverage.zip
This tells TeamCity to zip up the directory, and since coverage.zip is the conventional name for a code coverage directory, we’ll get a shiny new tab in our build result screen:
And that’s as far as I got with integrating all the great features of Nette Tester into TeamCity. From now on, I’ll have a recorded history of several code quality metrics and I hope that it will help me both deliver less bugs into production and speed up finding performance (and other) regressions.
Jak se kreslí realtime volební mapy pro statisíce lidí
Mezi bezpečností a ekonomikou
I’ve been using Nette Tester for a few years now, as I find it much more usable and straightforward than PHPUnit (disclaimer: I did use PHPUnit only for one very small project, a long time ago. It may be a good tool.). I also have a rudimentary deploy system in place using Git hooks, but it’s far from perfect – a lot of work must be done manually: composer install, deleting caches (if you use Nette Framework you know what I mean) and, most importantly, running those tests before actually pushing stuff.
Now sure, I could just improve the hooks, but then every commit/push (depending on which hook I’d use) would take a lot longer to complete, slowing me down. And making the hooks really bulletproof in all the edge cases would be just a lot of work for very little improvement.
Luckily, just as I was contemplating my situation, I was also experimenting quite a bit with JetBrains’ team offerings, especially YouTrack, as I’m always for the lookout for a usable time-tracking task list, and if it integrates with my IDE, all the better. And it was just a click away to find TeamCity, which promises to not only build, test and deploy my software, but also keep track of the test successes and failures, durations of those tests, monitor code coverage, provide timeline statistics for all those metrics and generally provide a lot of insight into the quality of my work.
The only trouble was, TeamCity has most integrations for Java a .NET projects, PHP is not supported out-of-the-box. Still, it can work with command-line tools, so anything with sensible exit codes can be made a build step, with anything except 0 failing the step and halting the deployment. So, with just that, you get a centralized deployment and error-reporting solution.
That’s all that it takes for a basic integration of Nette Tester into TeamCity. Previous two steps are calling composer install and if exist temp\cache rmdir /Q /S temp\cache. For testing purposes, it runs on my Windows box, moving to a Linux utility box is scheduled for when I have time.
You already have access to the build logs, where all your errors can be read in plain text. Still however, you’re missing on the conveniences that come when TC can parse your output like real-time feedback (you can see completing/failing tests as the appear, not after the whole tester returns), so let’s improve that.
Reporting on individual tests
Turns out, TeamCity supports its own message formats, and if it detects supported message in the stdout, it starts displaying all the fanciness it can. So, let’s bake that into Nette Tester.
Luckily, NT supports custom output handlers, that’s anything that implements the Tester\Runner\OutputHandler interface. And you can set NT to use your handler with a setup script, as shown in documentation. And the good news don’t end here: someone else has actually already done most of the work implementing the TeamCity compatible output handler. Jiří Pudil has a PHPStorm plugin for Nette Tester, and it’s setup.php script is just what we need. There’s just one minor trouble that it’s for an older version of Tester, but it’s mostly a matter of renaming and calling new APIs.
So now, we have to place that setup.php file somewhere within our project, and modify the command line accordingly:
php .\vendor\nette\tester\src\tester.php -c .\tests\php.ini --setup .\tests\setup.php .\tests
Woo! We’re getting all the individual tests here. From now on, we’ll have a tracking of when each of them failed, so we’ll know not only that something is broken, but also what.
Displaying test durations
Still, there’s room for improvement. Performance is a major factor nowadays, so having an idea of how long the test took would be a big help in case we’d introduce a major slow down in one of the commits and only find out later. For this reason, TeamCity offers a timeline of duration, so you can see whether the increasing of test duration was gradual, or (as is often the case) sudden, and therefore usually easy to pinpoint to a specific commit and a specific feature.
There’s a problem there tough: Nette Tester doesn’t call the OutputHandler when a test is starting, only when it’s finishing. Still, as with most things Nette, the code is elegant and easy to customize. I added the support for a new StartAwareOutputHandler in 14 lines of code, not including definitions and tests. Feel free to either cherry-pick that commit, or use the whole fork (however, I’d recommend rebasing to the current Nette Tester version after that, as I probably won’t be maintaining that fork much).
Now, we’ll just upgrade the setup.php with the newly introduced start method, move the testStarted message into it and implement a time-measuring associative array. Here’s my take at it.
With that done, the same command line step will yield durations, and after a few builds, a nice test duration timeline.
Enabling test coverage statistics
That’s about all that can be done for tests, but there’s still the issue of code coverage. You probably want to track how your coverage is changing over time, so that you know that the sudden prevalence of bugs reported from production is caused by your decision to rush development and skip tests. We’ve all been there :-)
Again, integrating Code Coverage reports into TeamCity is not something that works out-of-the-box, but is doable. For statistical purposes, we’ll use the XML output. NT uses the Clover format, same as PHPUnit, but again, TeamCity prefers its own message format. And again, there is a simple, already existing solution on GitHub. We’ll need to include the file with composer install (as is described in the readme), and then we’ll need to modify our test runner to both output the coverage XML to a file, then add a new step to read that XML, stdout the TeamCity messages and finally either delete the XML or archive it as a build artifact. I’m going to delete it, as I’ll be archiving the human-readable HTML report instead.
The new Tester command is straightforward, we’ll just add the coverage option and the sources root for it (otherwise, coverage will be generated for all files, including /vendor)
php .\vendor\nette\tester\src\tester.php -c .\tests\php.ini --setup .\tests\setup.php --coverage .\tests\coverage.xml --coverage-src .\app .\tests
Now we need the coverage output. We can either add it as additional commands into the Tests step, or create a new step. I created a new one, and set it to run the following custom script:
.\vendor\bin\teamcity-clover.bat .\tests\coverage.xml
del .\tests\coverage.xml
Again, it’s a Windows command, on *NIX, you won’t need the .bat and you’ll use rm instead of del. And, of course, use forward slashes.
With this, you should see a coverage report in the Overview tab of your build, and in the Parameters tab, under Reported statistic values link, you can track the changes over time (especially of the Percentage of Line/Block/Method/Class coverage, but other parameters are useful as well. And you can create your own parameters here, too, just output them in the TeamCity’s buildStatisticValue message format and they’ll be tracked.)
I definitely have room for improvement here…
Displaying human-readable coverage report
And we’re finally at the last step: archiving the coverage report as HTML, so that we can inspect it whenever we need. It’s simple: we’ll generate the HTML and tell TeamCity to create a build artifact out of it. And if we stick to conventional naming, it will generate a nice “Code Coverage” tab on our build page.
There is one problem however: to simplify user experience, Nette Tester has just one –coverage parameter, outputting HTML or XML by detecting the appropriate prefix. But you can’t output both files in one run, at least not without some (minor) modifications to CliTester.php. At this point, I’m running the tests twice, once for XML generation, then again for HTML generation. It takes double the time, but I don’t have to tweak the CliTester and break compatibility just yet.
Now, the way TeamCity displays the coverage is that it shows and iframe of the directory, starting with index.html. Therefore, in our new Command Line step, we’ll need to create a new directory, and after that, call the Tester.
if not exist .\tests\coverage mkdir .\tests\coverage
php .\vendor\nette\tester\src\tester.php -c .\tests\php.ini --setup .\tests\setup.php --coverage .\tests\coverage\index.html --coverage-src .\app .\tests
Next, we’ll switch to the General Settings tab and create a new Artifact path by appending a line to whatever paths we already have
tests/coverage => coverage.zip
This tells TeamCity to zip up the directory, and since coverage.zip is the conventional name for a code coverage directory, we’ll get a shiny new tab in our build result screen:
And that’s as far as I got with integrating all the great features of Nette Tester into TeamCity. From now on, I’ll have a recorded history of several code quality metrics and I hope that it will help me both deliver less bugs into production and speed up finding performance (and other) regressions.